
You will often hear casino players talk about the “long run.” They might repeat the common phrase that “the casino always wins in the long run.” Talking about what happens over a very long period also lets someone calculate the house edge or return to the player (RTP) for a given game. We think we have a good idea of what to expect when someone plays a casino game for an extended time.
However, people rarely specify precisely how long they mean. In any given session, someone’s wins or losses can vary dramatically from what the RTP would suggest. This variance leads to a natural question: what does the long run look like in slots?
Slots are a Volatile Game
We might expect the long run in slots to be interesting because slots are more volatile than most casino games. They have huge jackpots (even if they only pay out 1 in 100,000 spins) and a wide range of possible payouts. Compare this to games like blackjack and baccarat which typically pay 1 to 1 or 1.5 to 1 at best. Most bets in craps also return 1 to 1, though some are 2 to 1 or 3 to 1. In contrast, slots can pay 100 times the bet, or even more. Because of this, the long run is going to look very different in slots than it does for other games.
Find a Slot to Simulate
The best way to see what the long run looks like is to replicate a real slot through simulation. If we knew what each possible payout was and the chance that it would occur, we could use a computer program to replicate a session at the machine. The problem is that most slots are proprietary, and they will not tell you this information.
Fortunately, a few professors, Ashok Singh, Anthony Lucas, and others, were able to find an actual slot paytable and publish that table in a few journal articles. They make a couple of adjustments to the volatility and house edge for the comparisons in their work—I picked the one in the third column of their article here.
his chosen slot has a couple of metrics that we can look at:
- Return to Player: 94% - what percentage of money does the slot return to you over the long run?
- Variance: Moderate - how different are the payouts for the given slot?
- Win frequency: 21.5% - how often does the slot provide a winning payout?
- Hit frequency: 21.6% - how often does the slot return any money to the player?
- Jackpot: $500 - is there a large payout?
- Spin price: $0.10 - how much does each spin cost?
The 94% RTP is reasonably competitive with slots that you can find today. The variance is moderate because of the mid-sized jackpot. This jackpot also means that the win frequency and hit frequency are lower. It looks like there are a few losses disguised as wins because the hit frequency is slightly higher than the win frequency. These features are similar to some real slots that we may expect to see in a casino or online.
Run the Simulations
As mentioned before, the long run means something different to everyone. But one starting point is to picture a long weekend in Vegas playing slots. This might be a total of 20 hours of slot play across 4-5 days. We can use an estimate of 600 spins per hour to assume that the 20 hours would translate into roughly 12,000 spins (that’s a long time to play the same slot, but stay with me for the sake of example).
When people bring up the long term, they often imply that everyone’s winnings start to look the same after a while. So if 100,000 people played these 12,000 spins on the same slot, we would expect that their total winnings would be similar. Of course, each pull will be different, but throughout many spins, the hypothesis is that the ups and downs eventually even themselves out.
To put this to the test, I used a computer program to simulate this exact scenario: 100,000 people playing about ~20 hours each on this slot. That 2 million hours of playtime only takes about 10 seconds to replicate, and we can take a look at each person’s total winnings, subtracting out the money they fed into the machine.
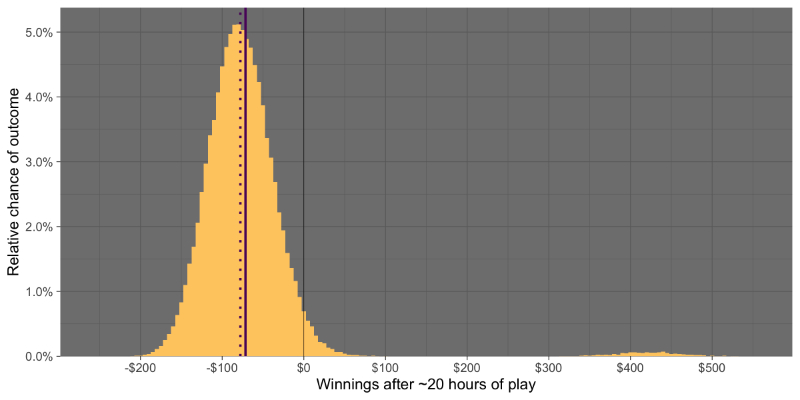
The graph above shows the relative chance of each level of total winnings binned into $5 increments. The solid purple line shows the average losses of $71.44 across all 100,000 simulations, and the dotted purple line to the left shows the median losses of $77.70. The median is just the winnings where we can perfectly divide the simulations in half—50,000 simulations above that value and 50,000 that are equal to or below it.
What’s interesting about this graphic?
- Most of the simulations end up forming this nice bell-shaped curve. Values concentrate around the mean and median values, suggesting that most of the players that would play our slot end up around this point.
- The peak of the bell curve is below zero, along with the average and median values. If the casino can get many people into it, then on average, those players will lose money.
- If you look closely, there is also a mound near $400. It corresponds to the lucky players who won the $500 jackpot but had some other wins and losses. About 1.6% of simulations fall into this mound.
- It is important to note that many of the points end up being quite far away from this center. Despite what we might expect, even 20 hours of play isn’t enough to ensure everyone sees the same average result.
The Longer Long Run
What do you think would happen if we instead simulated 5 of these long weekend sessions? Think of this like playing for a few months or a year. I suspect many people would think that because this represents a “longer run,” more values would end up closer to some average. Let’s try it out.
We simulate 100,000 sessions where each person plays the slot for a total of 100 hours (60,000 spins).

The results are somewhat surprising—a lot of the points are further away from the mean value! The dotted line represents the same curve from the previous graph to make the comparison easier. Interestingly, more people walk away with positive winnings in this scenario. We can see that the hump above zero is larger in this graph since more people are likely to win a jackpot if they play more sessions. Numerically, the percent of people winning money under this simulation is about 5.1%, compared to 3.8% after 20 hours of play.
What is not surprising is that the average person’s winnings are considerably lower. Since the casino always has an edge in their games, it will add up over a longer session. While more people would end up winning money after playing for 100 hours instead of 20 hours, the average amount of money they would expect to win after 100 hours is quite a bit lower. In the end, things sort of balance out.
Takeaways
There’s a lot to unpack from these simulations, and we expect the real world to be even more complex. Most people don’t play the same slot for 20 hours, let alone 100 hours. They will play multiple slots or even multiple different casino games. Each slot and game will have different patterns that will change the long-run results. Despite this, there are a couple of lessons that apply broadly:
- Over longer sessions, the possible values of winnings (or losses) only expand. This goes against common intuition and what most people think happens “in the long run.”
- Slots with a large jackpot end up having a smaller hump to the right of the main bell curve shape over a long session. The size of this hump depends on how big the jackpot is and how likely it is to happen.
- Longer sessions mean that, for the average player, they will give more to the casino. The cost of entertainment is more or less constant but adds up over very long sessions. However, your chance to win doesn’t necessarily go down.